Understanding Pre-Trade Liquidity
AI-powered tools and insights to improve best execution
Quantifying liquidity in the corporate bond market has been an historically challenging endeavor. The heavy concentration of trading activity in a small number of outstanding bonds complicates the process for estimating tradability. The “buy and hold” nature of bonds is another contributing factor. In this article, we examine the distribution of trading activity seen in the market. We then lay out the process we employ to generate the LTX Liquidity Scores and provide guidance on how to interpret these metrics.
At LTX, we define liquidity as the ability to sell a bond at a reasonable price and within a reasonable amount of time. To create quantitative metrics for liquidity in the US Corporate bond market, we currently apply advanced data analytics and Machine Learning (ML) to analyze historical trading patterns in FINRA’s TRACE data set. These trading patterns are compared across the market to categorize the universe of bonds into liquidity score buckets. We then calculate a series of adjustment factors that allow the scores to reflect preferences detected for dealers and buyside customers who are active in the market. The models are updated each night to capture the everchanging market dynamics.
KEY FACTORS
As of January 31st 2021, there are ~22,500 corporate bonds designated by LTX eligible for inclusion on its trading platform. Out of these bonds, only ~17,900 bonds (80% of the eligible CUSIPs) have traded at least once over the 3-months, beginning October 30th. Figure 1 below shows the cumulative distribution of aggregate trades, for all traded CUSIP’s in descending order.
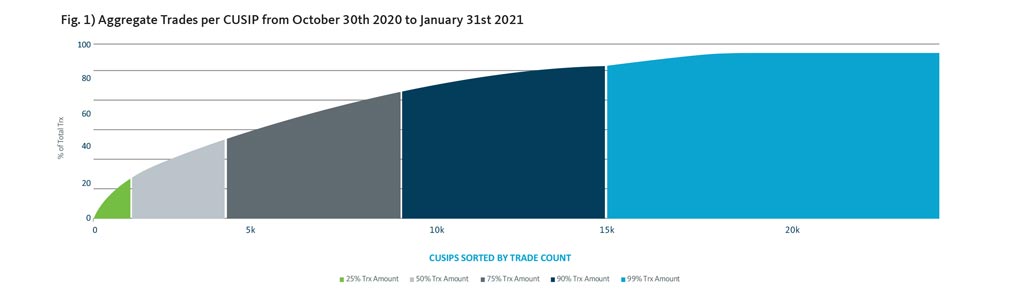
As you can see, the 450 most frequently traded bonds (2% of LTX tradable bonds) account for 25% of all TRACE trades. Trade frequency drops as you move deeper into the list of bonds. Note that it takes nearly 3 times as many bonds to reach 50% and an even larger increases to get to 75% of transactions and beyond.
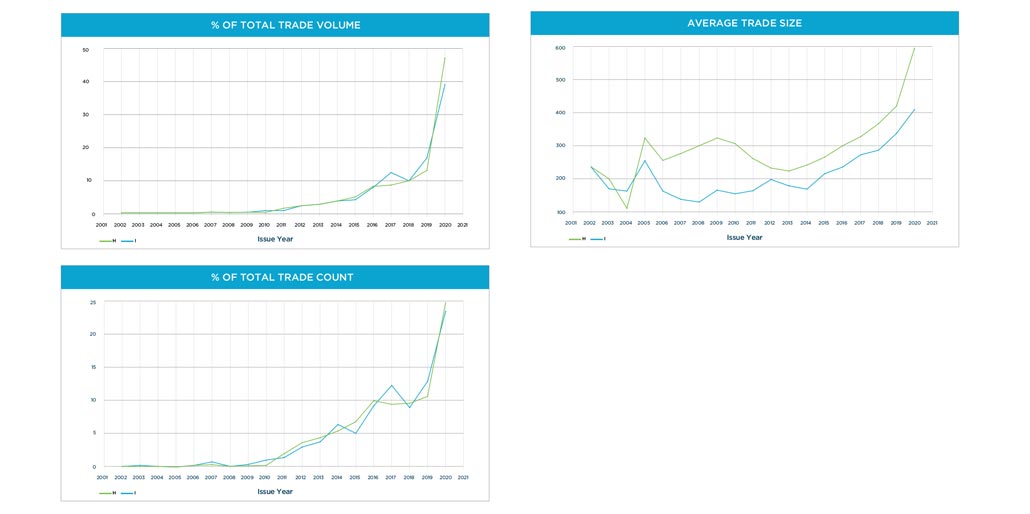
Time since issuance plays an important role in trading activity. The charts below show the number of bonds traded and their total volume for each year of issuance.
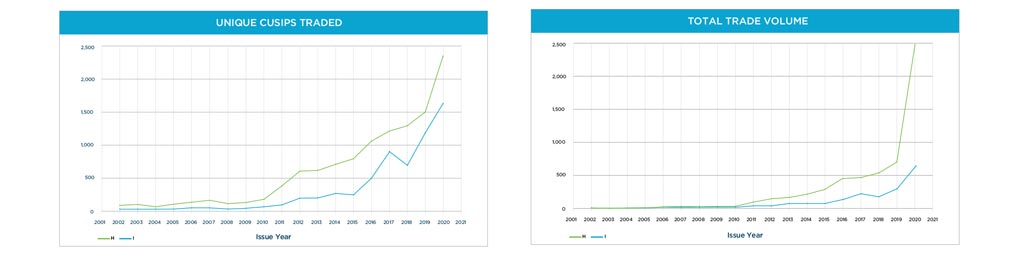
They show that the overwhelming majority of bonds traded today were issued after the 2008 Financial Crisis. The trade volume of pre-crisis bonds is marginal for both the IG and HY sectors. The importance of the age of the bond is especially strong for the investment grade sector. It is also worth noting the continued rise in volume for the 2018 and 2019 vintage bonds, despite falling trade counts – implying larger average trade sizes for these newest issues.
LTX LIQUIDITY SCORE®
The liquidity scores generated by LTX aim to help clients establish realistic expectations about their ability to execute specific trades. To deliver on this goal, the scores must:
- Account for each bond’s underlying liquidity captured by TRACE
- Provide realistic estimates of the sensitivity to changes in trade price, relative to the fair market value of the bonds and sensitivity to trade size, relative to the typical transaction sizes reported by FINRA.
- For each dealer analyzed by LTX, the liquidity score should account for the dealer’s strength trading a chosen bond. Similarly, the score reported for each of the dealer’s clients should reflect the client’s historical activity in the bond and similar issues.
- Reflect bonds that have a higher likelihood of trading on the LTX platform with the RFX protocol.
An ideal liquidity score should resemble the ease to trade a bond (compared to its peers) at a given time, price and quantity. As of 2/2/2021, all the corporate bonds have been bucketed into integer values from zero to ten. These buckets are based on historical trading patterns coming from TRACE transactions and Broadridge’s IMPACT dealer data. Each step between zero and ten represent an incremental jump in the ease to sell or buy a bond. A liquidity score of zero represent bonds that have not trading during our longest time window (past 60 business days).
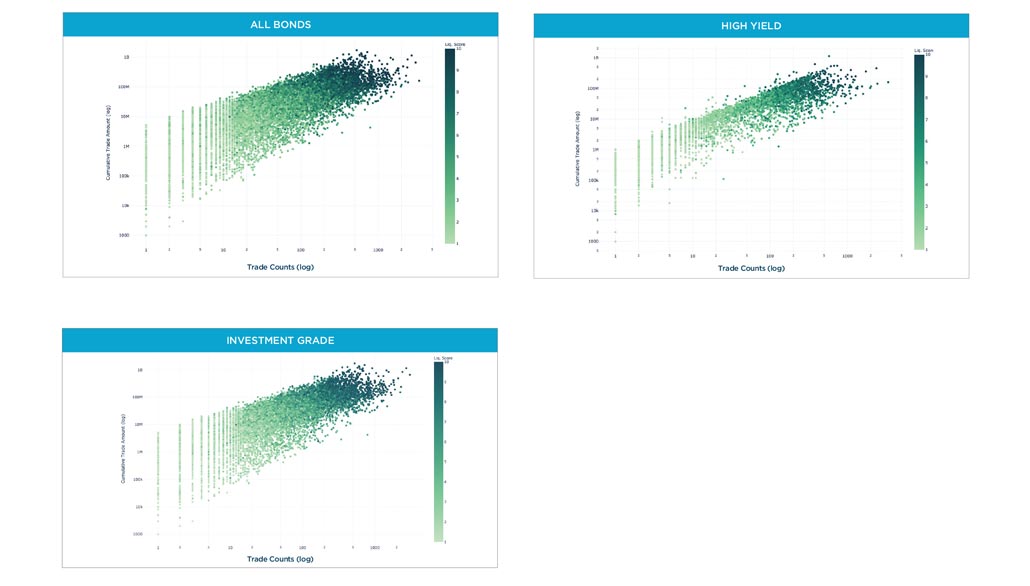
At LTX, we have tackled this problem by first calculating the trade count and volume (aggregate trade amounts) flowing through each bond in the market at various windows of time. In the figure below, we have calculated the number of trades for all bonds at 3 different time windows (one week, one month and three months). The total transactions clearly increase as the window expands but the relative trends are surprisingly similar. Applying a proper normalization routine for time would exhibit a high correlation between each of these curves.
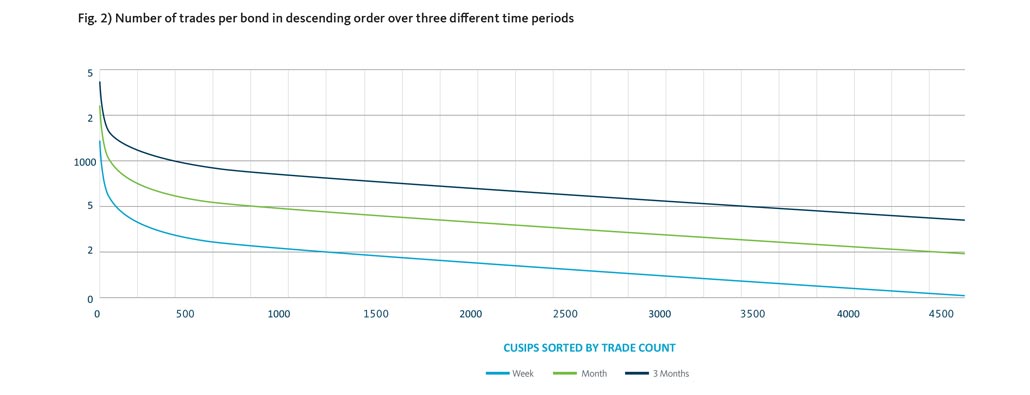
On a global scale, a larger frequency of trades would equate to a larger traded volume. Although, at a local region, bonds can have more trades but far less volume. This led us to incorporate a multivariate analysis for volume and trade count in our liquidity score.
The Trace Liquidity Score (TLS) equation measures the tradability of a bond based on the volume and count of historical trades.
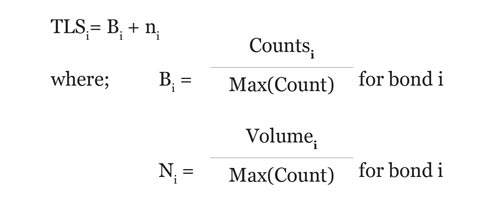
The Counti and Volumei are the total count and volume for bond i. The maximum values for trade count and volume correspond to the bond that had the maximum volume or trade count for a given window of time.
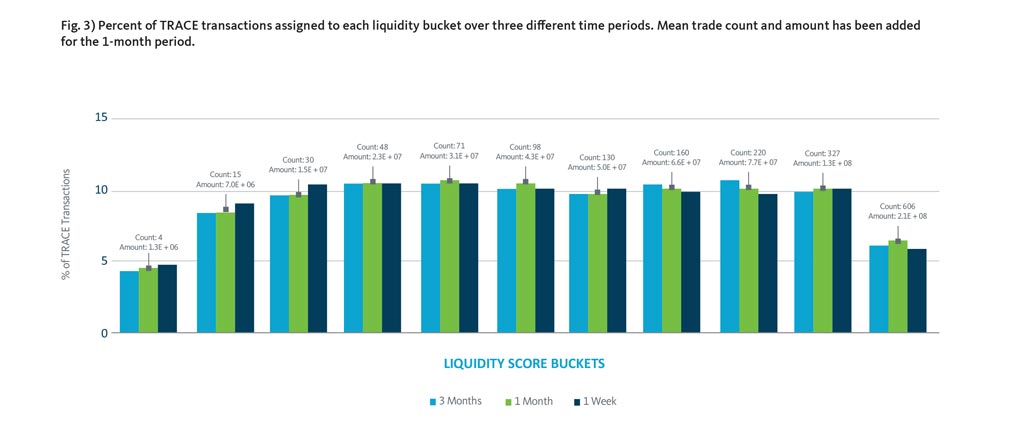
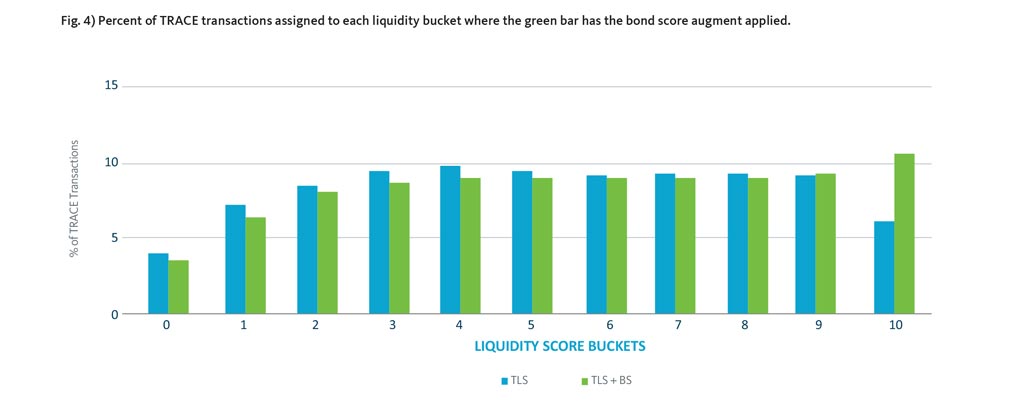
Due to the non-normal distribution of trading behavior for CUSIPs, a logarithmic transformation has been applied to the resultant of equation 1. This transformation essentially converts the original distribution into more of a bell-shaped curve. At this point, TLS can be bucketed into a decile range. Figure 4 visualizes the resulting transformation by assigning CUSIPs a liquidity score. The three bars correspond to the assigned bond’s liquidity scores at 3 periods of time. mean trade count and volume for each bucket (on the one-month period) has been added. As you can see, the distribution of liquidity scores in the market remain relatively steady over time.
Possessing dealer’s transactions and positions has provided LTX a unique opportunity to paint a more complete picture of the market. TRACE provides a highlevel view of the fixed income market while maintaining anonymity at the granular level. IMPACT data fills the gap that TRACE leaves with highly detailed information on the specifics behind a trade. Leveraging and reflecting this data within a liquidity score is vital for the end user to successfully navigate the market. To maintain anonymity and adhere to security protocols, LTX has not comingled dealer’s data to calculate these scores.
Another market assumption is that dealers have a propensity to trade certain securities more often than others. This dealer “strength” in sectors of the market has been created by utilizing the CUSIP’s trading patterns at the global (TRACE) and local scale (IMPACT). This dealer score is applied as an augment to the existing TLS. We have chosen to augment the existing TLS to reflect the fact that a less liquid bond will still be relatively illiquid even if a specific dealer has disproportionally traded it.
The Dealer Score (DS) equation measures the proportion of trades and total volume that has flowed through a specific dealer.
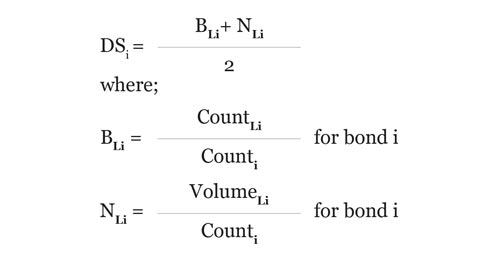
The CountLi and VolumeLi are the local (dealer) count and volume for bond i. Counti and Volumei are the total count and volume for bond i over a window of time.
In the figure below, the dealer augment has been applied to the 3-month liquidity score distribution. This augment pushes a small proportion of less liquid bonds into a higher bucket due to that dealer’s past trading activities.
The liquidity scores thus far have accounted for the aggregate trading activity of bonds. Facilitating vital bond features like trade price and trade quantity are necessary for accurate liquidity measures. As mentioned in the intro, bid ask spread has been widening over the past decade. This has been obvious in the illiquid bonds where lack of data fuels the uncertainty of proper pricing.
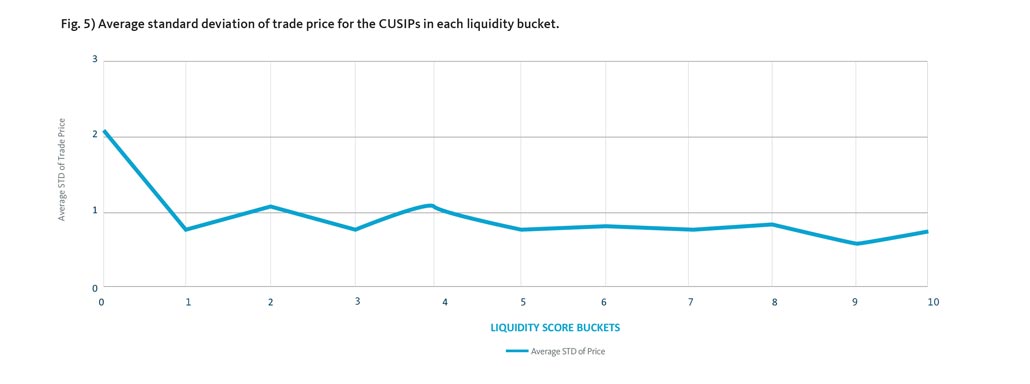
The variance of trade prices for a specific CUSIP (on small time periods) has a direct correlation with the bidask spread. In addition, there is an inverse relationship between liquidity score and price variance. As liquidity score decreases, the price variance tends to increase. Fig. 5 plots the average standard deviation of trade price for bonds assigned to each bucket.
Factoring in price to the liquidity metric is detailed below.
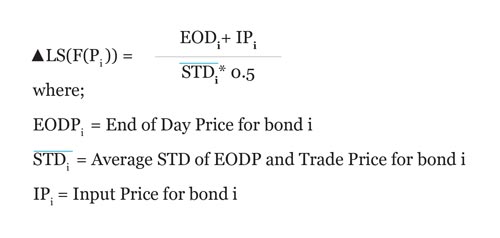
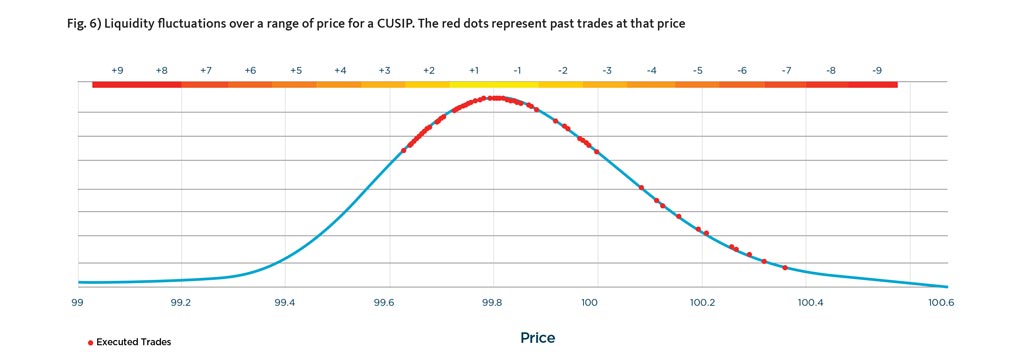
The price liquidity metric measures price volatility at the bond level over the same window of time as the TLS. The EODP is currently provided by a third-party source and will ideally be replaced by real time pricing soon. The graph below demonstrates the equation applied to a CUSIP.
The red dots are historical trade prices for this bond and the blue line represents the kernel density estimation for a range of prices. The color-coded line above the graph represents the dynamics of the liquidity score for the given price range.
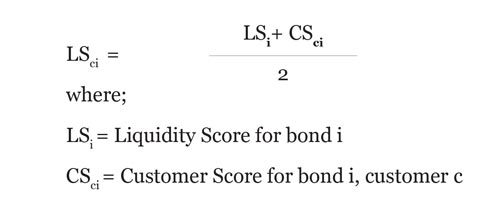
CUSTOMER LIQUIDITY SCORE
A previous white paper by LTX detailed the recommendation engine technology. This recommender suggests customers for a dealer’s positions. Liquidity scores measure the likelihood of trading a bond and the recommender predicts where to trade it. These two metrics, if coupled, can be a very powerful tool for a trader to wield. The issue with combining these tools are coalescing of the dissimilar outputs. The recommender outputs a ranked order list with associated probabilities from a Neural Network (NN). Currently, we scale these NN probabilities with the bond liquidity score. These scores are subject to continued research and will likely be utilizing data from user activity on the platform in favor of probability output from our NN. The output from the NN has been bucketed into customer scores which are scaled to integer values from 0 to 10. The equation below quantifies the coalescence of the liquidity scores with the recommender output.
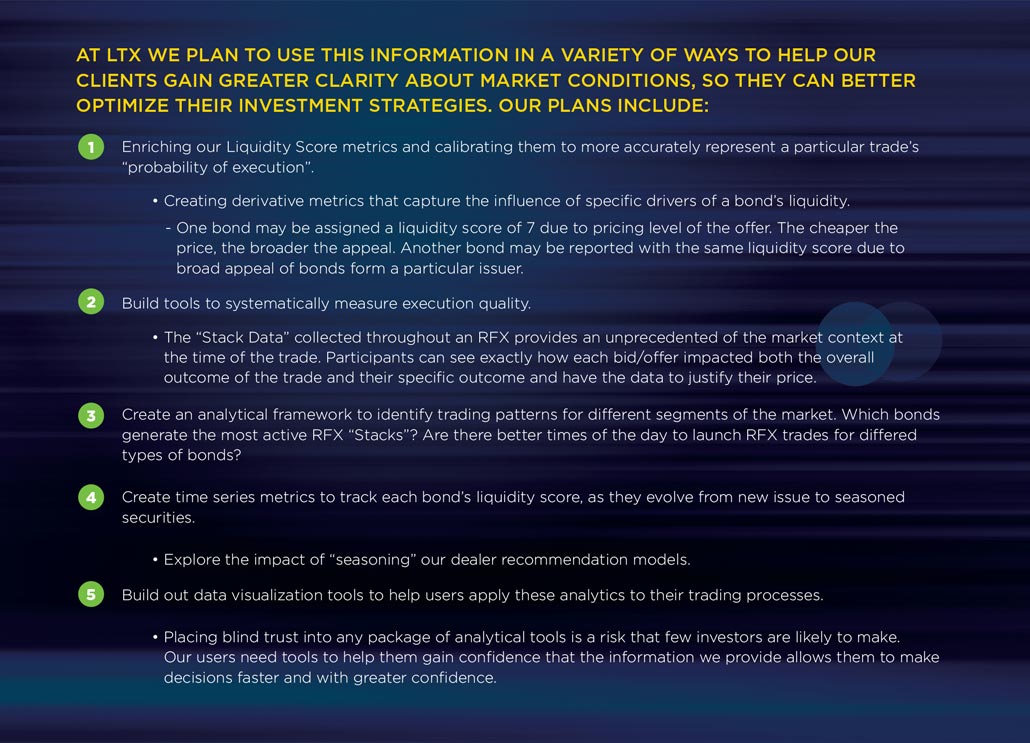
BUILDING IN INTELLIGENCE
As Larry Tesler stated, “AI is whatever hasn’t been done yet”. Tasks that have historically been viewed as expressions of “intelligence” are being tackled and often solved using AI technology. LTX employs deep learning algorithms on millions of executed trades to help dealers gain a deeper understanding of the complex dynamics of their client trading interactions. These insights are embedded directly into the LTX trading platform. Capturing the outcomes of LTX RFX trading sessions initiated on the basis of our client-level liquidity scores provides our data science team with crucial knowledge about the accuracy of these measures. The reactions to these scores by end users, or what data scientist call impressions, will help our models learn to make smarter predictions.
Today, fixed income investors face significant challenges when asked to commit to a trading level, as either a buyer or seller. Many pre-trade pricing sources are still indicative levels, which may shift when one moves to execute. The intensity of the demand for a trade is also difficult to validate. The RFX protocol begins to address these types of issues. A seller is able to engage multiple potential buyers at the same time (or a buyer, multiple sellers). All active participants receive a much clearer view of the market conditions for this opportunity. Anyone who makes a commitment to trade can monitor the pricing dynamics of the trade and make informed decisions on how to manage their own activity. At the end of the trading session, all this data is provided back to each active participant.
CONCLUSION
According to SIFMA, the total amount outstanding in US Corporate bonds grew to $10.4T (as of Q3-2020), up from $9.6T at the end of 2019. Despite an 8+% growth in the size of the market, participants continue to voice concerns about liquidity in the secondary market. New trading protocols, such as List Trading, have been created to help alleviate some of the stress but to be fully effective, traders and investors need tools to help improve the efficiency of their trading process. To do this, the community needs more data from active trades.
The LTX “Stack” data is poised to begin filling this important information gap. Our team of data scientists have been working to create a realistic roadmap to leverage the content generated by the RFX trading protocol to create a feedback loop that improves the entire trading process. The ideas presented above can help market participants begin to adapt their processes to a more data-centric approach that modernizes the backbone of secondary trading in the corporate bond sector.